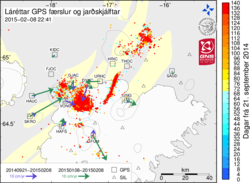
Comparison of displacement velocities for different time periods
Subsidence of the Bárðarbunga caldera scrutinized
The Bárðarbunga seismic- and volcanic events provide multitude of data, supporting various research.
Now a map has been presented that compares displacement velocities of GPS stations in the vicinity of Bárðarbunga over the past month, with their displacement velocities from 21st of September until today. The date 21st of September was chosen because by then, displacement velocities related to the propagation of the dyke had become negligible and the large displacement signals around Bárðarbunga were solely due to the subsidence of the caldera.
This experimental project is intended to monitor the long term development in deformation around Bárðarbunga. After the eruption in Holuhraun began, GPS stations around Bárðarbunga have been showing continuous displacements towards its caldera (a subsidence signal). Since then, the rate of subsidence has been slowly decreasing. These changes in displacement velocities are very slow and can best seen by looking at a longer time series, where the velocity decrease behaves exponentially.
However, varying conditions in the Earth‘s atmosphere as well as icing due to cold weather may cause temporary distortions in the GPS reference network. Such distortions can last for days and show displacements that aren‘t real. Therefore, changes in displacements are interpreted with caution.
For further explanation, see GPS map, Displacement velocities compared.


