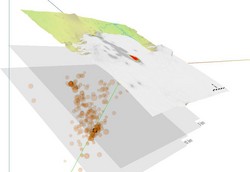
Bárðarbunga earthquakes - interactive model
Seismic activity 2014 in NW Vatnajökull visualized
IMO‘s seismic data is here presented in an interactive and three dimensional model where the location of all earthquakes in northwestern Vatnajökull ice cap from 16 August 2014 can be seen and explored. The list of earthquakes updates every five minutes. Click this link to run the model:
An interactive 3D model of the earthquakes in Bárðarbunga – preliminary version
However, this is a preliminary version; the model is still being developed. There are some browser issues, e.g. Google Chrome and Firefox run it, IE10 does not; other browsers have yet to be tested. In some instances the operating system does not support the requirements or the hardware causes problems. But most of the users of en.vedur.is should be able to find their way to enjoy this product. A demo version is available below.
Instructions
The topography is exaggerated by factor 5, while depth in the model is not exaggerated. The depth of the earthquakes is indicated by two planes, at 5 km and 10 km, but in fact the uncertainty is great. For simplicity, the earthquakes are positioned with sea level as a referral plane.
Coloured patches on the surface represent the 20 most recent earthquakes. As the coloured patches move on they leave a gray color, which consequently shows where the activity has been. Doing is learning and our users are encouraged to test out the interactive possibilities:
- zoom in and out (central mouse scroll), pan (right click), turn over (left click)
- choose speed 1x, 2x, 10x (available in some browsers (e.g. Chrome but not Firefox)
- coloured patches on/off (ring icon)
- choose landscape map (mountain icon) or satellite image (bell icon) for the surface
Tryggvi Hjörvar, specialist at the Icelandic Met Office, created this model.


