Instructions on using station forecasts
Station forecasts are automatic forecasts for specific locations. Station forecasts rely on regular weather observations in the same location.
New station forecasts are computed a few times every 24 hours.
In summary
- It is important to read the text forecast instead of relying solely on the forecast map. If a large discrepancy exists between the automatic, map-based forecast and the text forecast for a specific area, then the text forecast applies.
- Keep in mind that short-term forecasts are more likely to be correct than long-term forecasts.
- The sliding bar beneath the map is used to view the various forecast periods. It is possible to click on the sliding bar, the days, the hours, or the arrows at the either end of the bar. Additionally, the left and right arrows on your keyboard can also be used for navigation.
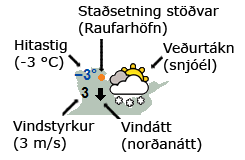
- The maps contain weather symbols that describe temperature, wind speed and wind direction.
-
The orange point on the maps shows the location of the area.
-
If the cursor is placed over a location, then the name of that place appears, along with the text forecast and further information about precipitation.
- By clicking on a region, a forecast is displayed beneath the map for conditions at midday during the next few days, together with the present conditions in the area. It is also possible to view the forecast for the chosen location as a meteogram.
- Above the map there is a pull-down menu for choosing other categories of weather station; e.g., coastal or highway stations.
- Below each map there is a search option to find forecasts for specific locations. Enter the first letters in the name and then choose the place from the list that appears.
- Clicking the ‘table' tab above the maps shows the same forecast in tabulated form.
Further information
The text forecast is always the most up-to-date source of information
If a large discrepancy exists between the automatic forecast and the text forecast for a specific area, then the text forecast applies. It is normal that some discrepancies may occur between automatic station forecasts and text forecasts for that area. The text forecast applies to a large forecast region, whereas the station forecast applies to a specific place. There may be differences in weather between one locality and the whole region.
Note that, in some cases, the automatic forecast can be outright wrong. It is therefore advisable to check the latest text forecast as well, instead of relying solely on the map-based forecast.
There are two reasons why automatic station forecasts might be inaccurate:
- During abrupt changes in weather the corrective algorithm for the station forecasts tends to yield inaccurate results.
- The weather forecast model, on which the station forecasts are based, sometimes produces incorrect results. Each day, IMO receives results from several meteorological forecast models. A meteorologist analyses these results and bases the text forecast on the data that are the most likely to be correct at that time.
Representation of forecast data on the forecast maps
 Forecast maps contain the following data: weather symbols, temperature, wind speed and wind direction. The orange point shows the location of the relevant meteorological station, as shown in the image to the right.
The wind arrow shows the direction of the wind. If the wind is coming from the north, then the arrow points down.
Each weather symbol is, in fact, a compilation of other elements in the forecast. See other weather symbols that are used in station forecasts and observations.
If the cursor is positioned over a set location, then the name of that location appears alongside, together with the validity period of the forecast and the forecast data in text format. Additionally, a graphical overview of the forecast appears below the map; the same forecast can also be viewed as meteogram.
When a location is clicked, the URL in the browser changes. If you regularly view a forecast for a specific location, it could be useful to save the URL as a bookmark in your Internet browser.
The sliding bar below the map is used to change the period of the forecast
It is possible to change the validity time in many ways:
- It is possible to click anywhere on the bar.
- It is possible to click on the days above the bar to view the noon forecast for a specific day.
- It is possible to click on the time below the bar.
- It is possible to click on the arrows on either side of the bar to view the previous or the next validity period.
Search option and menu to change the station forecast categories
To find a place or a weather station it is convenient to use the search option below each map. Enter the first letters of the name, and then choose the place from the list that appears.
The dropdown menu above each map is used to change the type of station forecast. There are several available categories, but not all categories are applicable to some map regions. Note that it is common to see the same station in more than one category.
It is also possible to view the station forecasts in tabulated format
By clicking the ‘table' tab above the map the same forecast can be viewed in table form. Note that the tables contain more weather elements than the maps.


